Autonomous microgrid control
Intelligent monitoring, control, and optimization for solar and storage microgrids. GridBrain forecasts your generation, manages your batteries, and keeps you compliant, without waiting for someone to log in.
Illustrative values. Your dashboard streams live readings from your own equipment over Server-Sent Events.
A complete platform for microgrid operators and energy communities: collection, control, compliance, and billing in one system rather than four.
Live battery state of energy, solar production, grid power, and demand streamed to your dashboard as it happens. Per-circuit breakdowns come straight from revenue-grade metering, so what you see is what the meter saw.
A K-nearest-neighbors model learns how your specific array behaves, then combines that with a 48-hour weather forecast to predict tomorrow's generation. GridBrain uses that curve to decide when to lean on the grid and when to coast on sun.
One dashboard across every site you operate, with health, state of energy, and open issues at a glance. Role-based access means a site manager sees their site and an operator sees the whole portfolio.
Per-unit energy billing for residential and commercial tenants, with PPA rate modeling, historical consumption, and exportable reports. The numbers you bill on are the same readings the control loop ran on.
Automatic PV curtailment over Modbus with dead-band control keeps you inside your interconnection agreement and stops reverse power flow before it starts. If the meter stops answering, the site falls back to a safe state rather than guessing.
Push notifications through the installable web app, SMS for the events that matter at 2am, and a full audit log for everything else. Alerts carry the reading that triggered them, so you start diagnosing instead of hunting.
Screens from the running platform. The fleet shown is sample data — real client sites stay private.
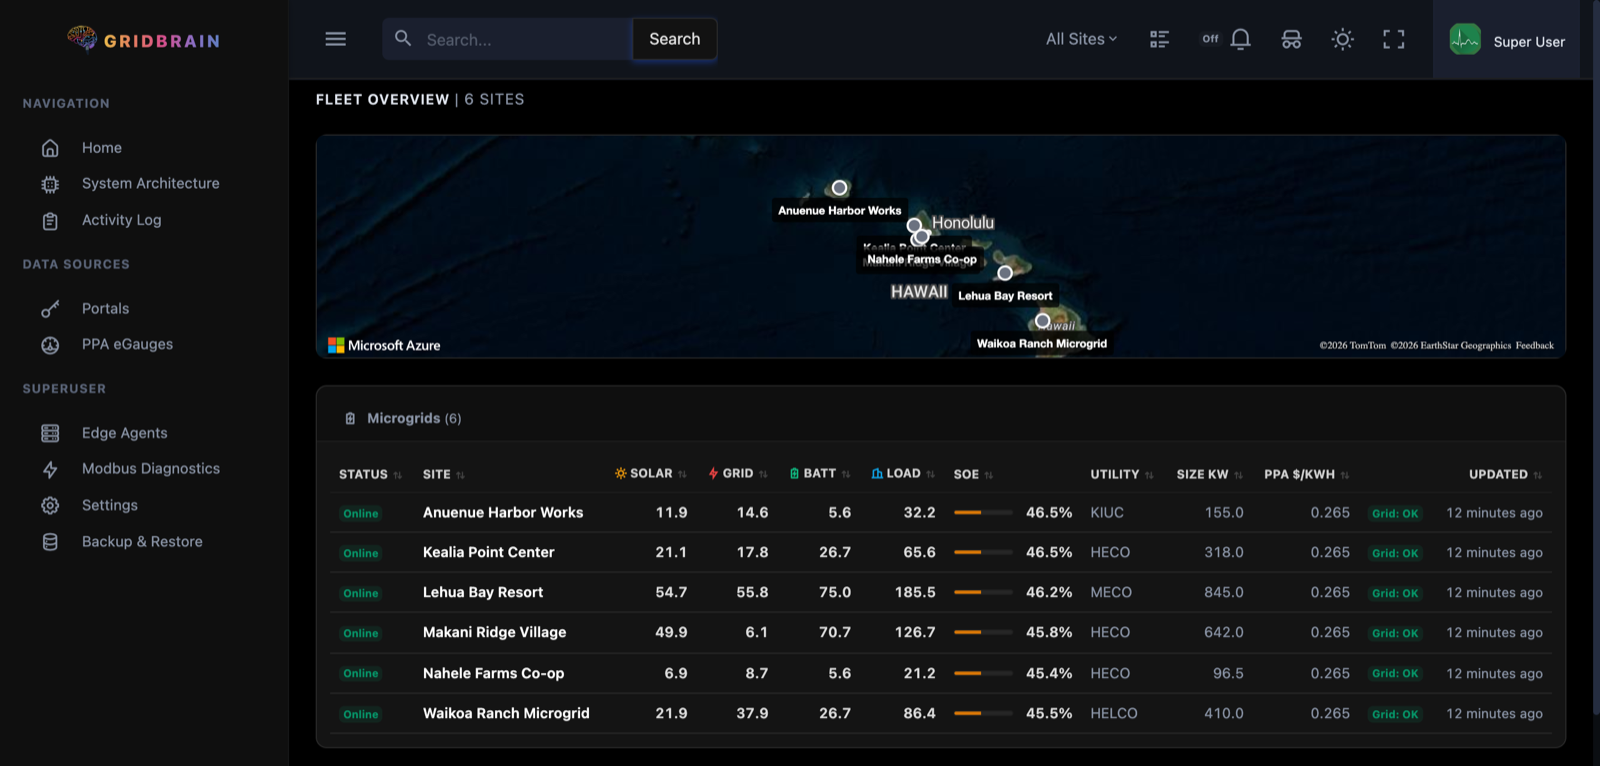
Solar, grid, battery, load and state of energy for the whole fleet, each row live and each site one click away. Status is derived from the last reading, not from a checkbox someone forgot to tick.
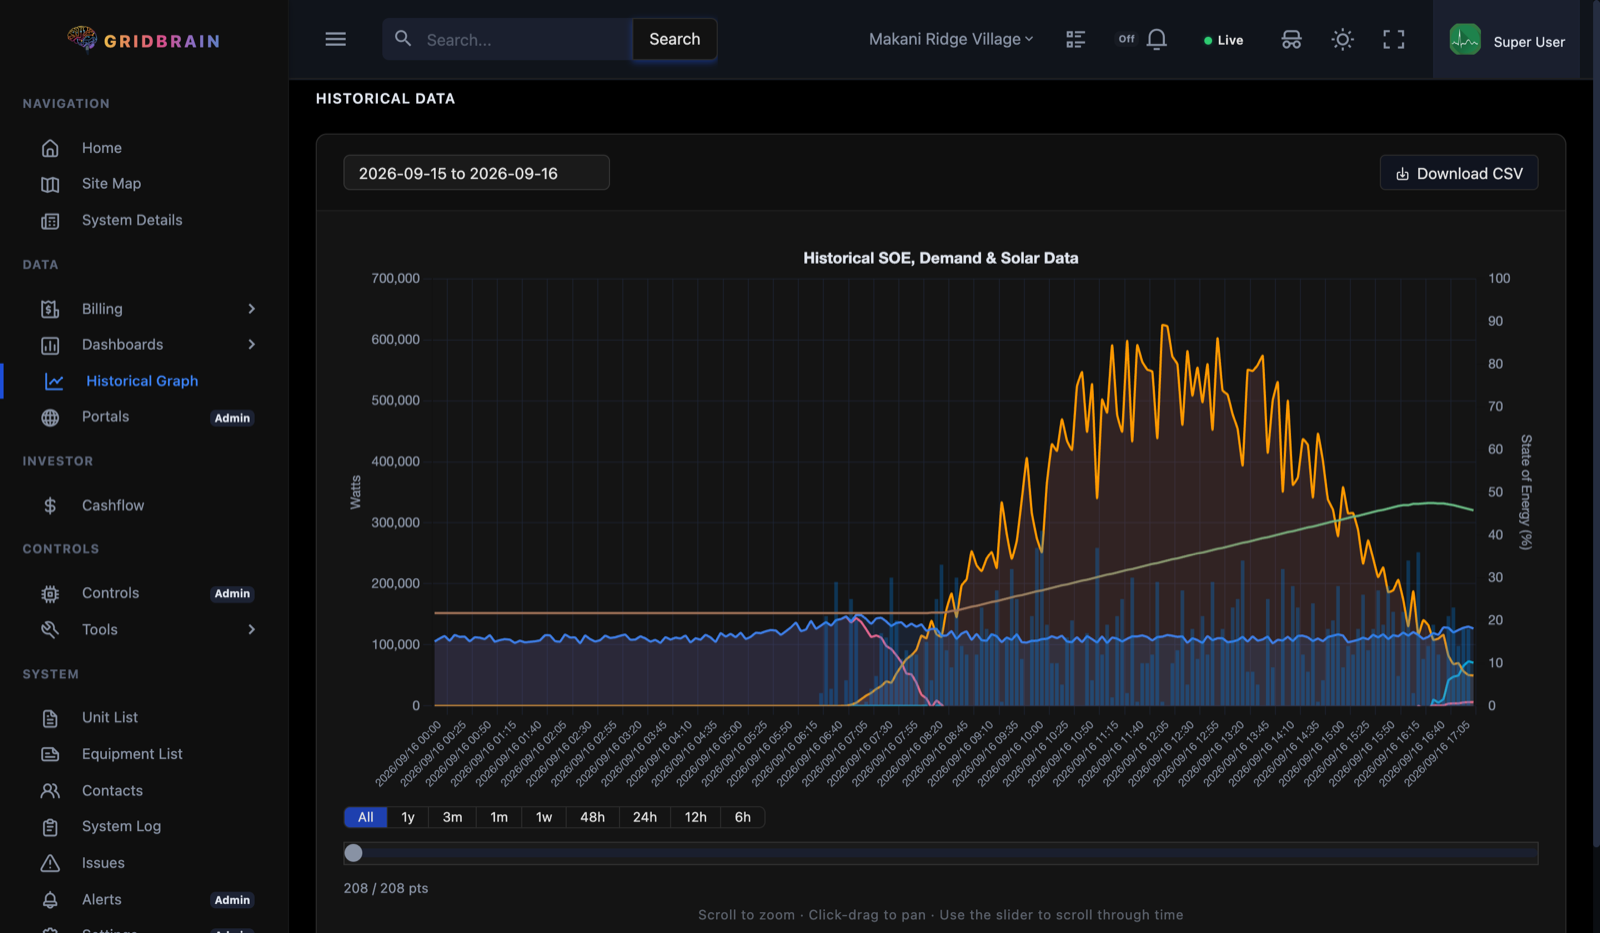
Production, demand, grid draw and state of energy on one axis pair, down to five-minute resolution. Scrub any window from six hours to a year, and take the CSV when you need to argue with a utility.
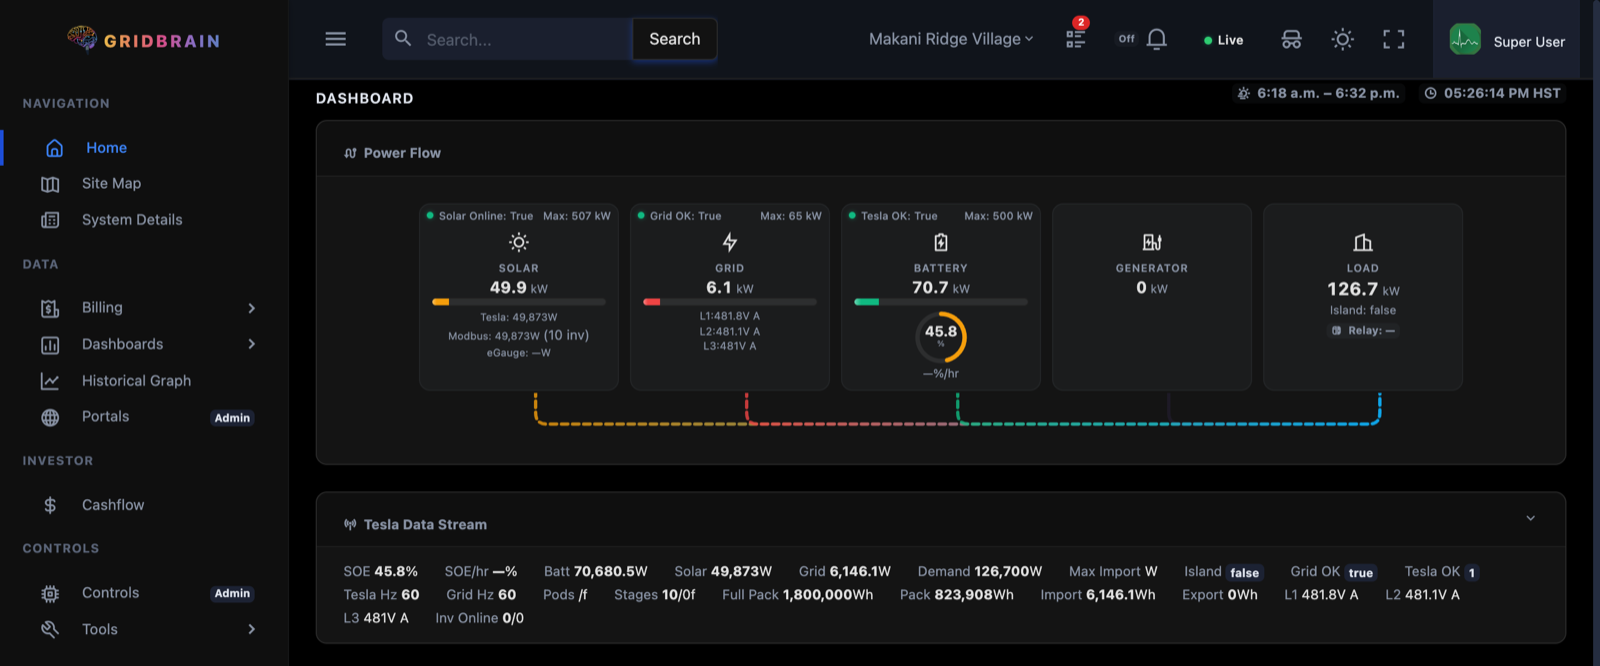
Where the energy is going right now, with the unedited telemetry underneath it — pack watt-hours, per-phase volts, frequencies, inverter counts. The summary is for the glance; the stream is for the argument.
GridBrain isn't locked to a single vendor. Connect the equipment you already have, or mix and match as your site evolves. Adding a device family means writing a collector, not replacing a switchboard.
Tesla Powerwall, Powerpack, and Megapack through the local gateway API: state of energy, battery, grid and solar power, island mode, and grid codes. Extensible to any REST or Modbus-accessible BESS.
SMA Sunny Boy and Tripower over authenticated HTTPS plus Modbus TCP, Fronius through the Solar API, and SolarEdge over SunSpec Modbus with scale-factor decoding. AC power, value codes, reset, and curtailment.
eGauge revenue-grade meters with instant, cumulative, and per-circuit readings, generic Modbus energy meters, ControlByWeb relay I/O, and any HTTP or MQTT data source you can point at us.
The agent runs on ordinary Linux or Windows hardware: Raspberry Pi, Intel NUC, industrial PC, or a virtual machine. No proprietary gateway, no dedicated rack, no truck roll to swap a box you already own.
Modbus TCP, SunSpec, REST, MQTT, and HTTP. New hardware is a collector plugin against a documented interface, so support arrives as a software release rather than a firmware campaign.
Layer GridBrain onto an existing installation without replacing equipment. It runs alongside legacy SCADA, building management systems, and utility interconnects instead of demanding you rip them out.
From installation to autonomous operation in four steps.
Install a lightweight Python agent on-site. It connects to your Tesla gateway, inverters, meters, and relays over the local network, and authenticates to the cloud with a per-site API key. Modbus inverters are rediscovered automatically if their addresses change.
Set battery thresholds, relay schedules, curtailment limits, and control parameters from the fleet settings dashboard. No config files on the box.
Once commissioned, the forecaster learns your array, projects state of energy forward, and optimizes grid import continuously. You set the limits it operates within, and you can take manual control at any time.
Track battery state of energy, solar production, grid import, and site demand across the fleet. Alerts fire when a site drifts, and you adjust thresholds, relay schedules, and curtailment limits as seasons and tenants change.
The same platform covers a single home battery and a multi-tenant commercial campus. What changes is the configuration, not the software.
Shared solar and storage across many units means somebody has to answer who used what. GridBrain reads per-circuit consumption and produces per-unit bills on residential, commercial, or PPA rates.
Zero-export sites fail expensively and quietly. Continuous metering with Modbus curtailment and dead-band control holds export at zero, and a meter that stops responding drives the site to a safe state instead of a guess.
The edge agent is designed for bad connectivity. Control decisions are made locally, readings queue to an on-disk buffer while the uplink is down, and the queue drains when it returns. Nothing is lost to a flaky tunnel.
Fleet view ranks sites by what needs attention rather than alphabetically. Drill from portfolio health into a single inverter's value codes without changing tools or logging in again.
Production-grade infrastructure for real-world microgrid operations, from the cloud down to the Modbus register.
The part that matters to you is the middle row. The edge agent keeps controlling your site whether or not the cloud is reachable, buffers readings locally while the link is down, and sends them when it returns. Losing your internet connection does not mean losing control of your batteries.
The things operators ask before they deploy.
No. GridBrain is a retrofit layer. It reads and controls the Tesla gateways, inverters, meters, and relays already on site over their own protocols, and runs alongside existing SCADA or building management systems. If your hardware speaks Modbus TCP, SunSpec, REST, MQTT, or HTTP, it is already in scope.
The site keeps running. Control decisions are made by the edge agent locally, not in the cloud, so curtailment and battery management continue through an outage. Telemetry queues to an on-disk SQLite buffer and drains to the cloud when the link returns, so you do not lose the history either.
Very little. It is a Python service that runs on ordinary Linux or Windows hardware with network access to your equipment: a Raspberry Pi, an Intel NUC, an industrial PC, or a virtual machine on hardware you already have. There is no proprietary gateway to buy.
A K-nearest-neighbors model is trained on your site's own generation history, so it learns your array, your shading, and your local weather pattern rather than a generic curve. That model is combined with a 48-hour forecast and cloud cover factors to project generation, and a state-of-energy trajectory is simulated forward before any control decision is committed.
Continuously, with hysteresis. The agent watches the meter and curtails PV over Modbus using dead-band control, which avoids the oscillation a naive threshold produces. Critically, if the meter stops answering, the site is driven to a defined safe state rather than continuing on a stale reading.
Yes. Per-circuit readings from revenue-grade eGauge metering feed per-unit billing with separate residential and commercial rate structures, plus PPA modeling for third-party owned generation. Statements and historical consumption export for your accounting system.